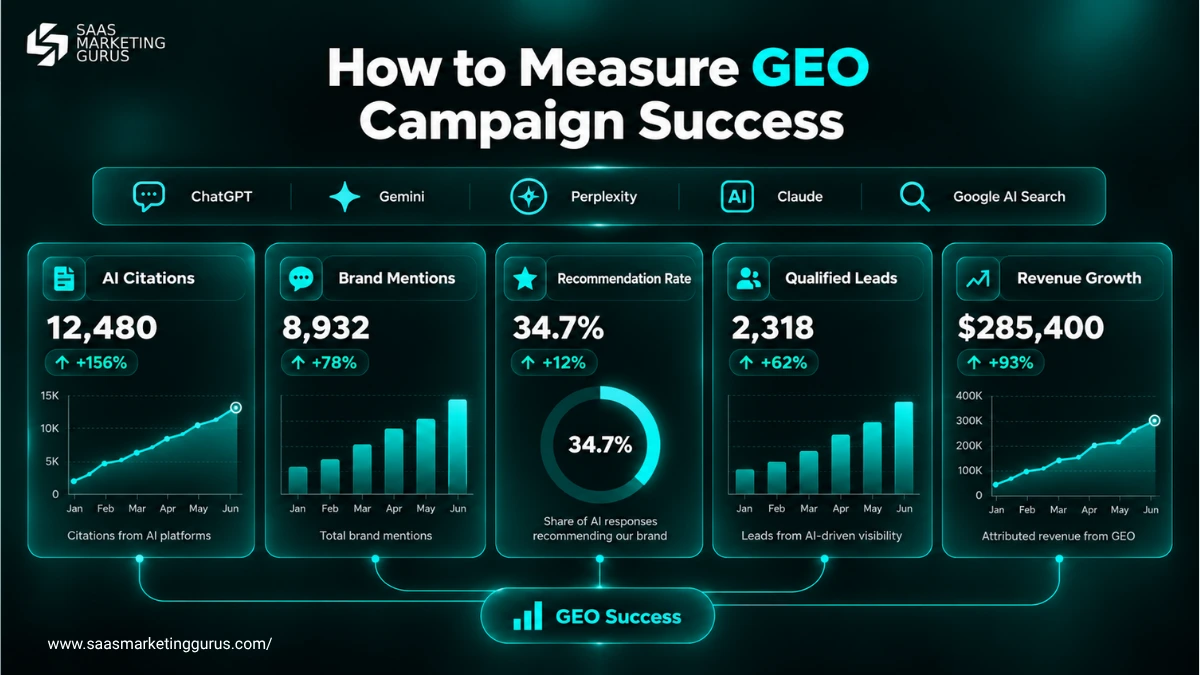
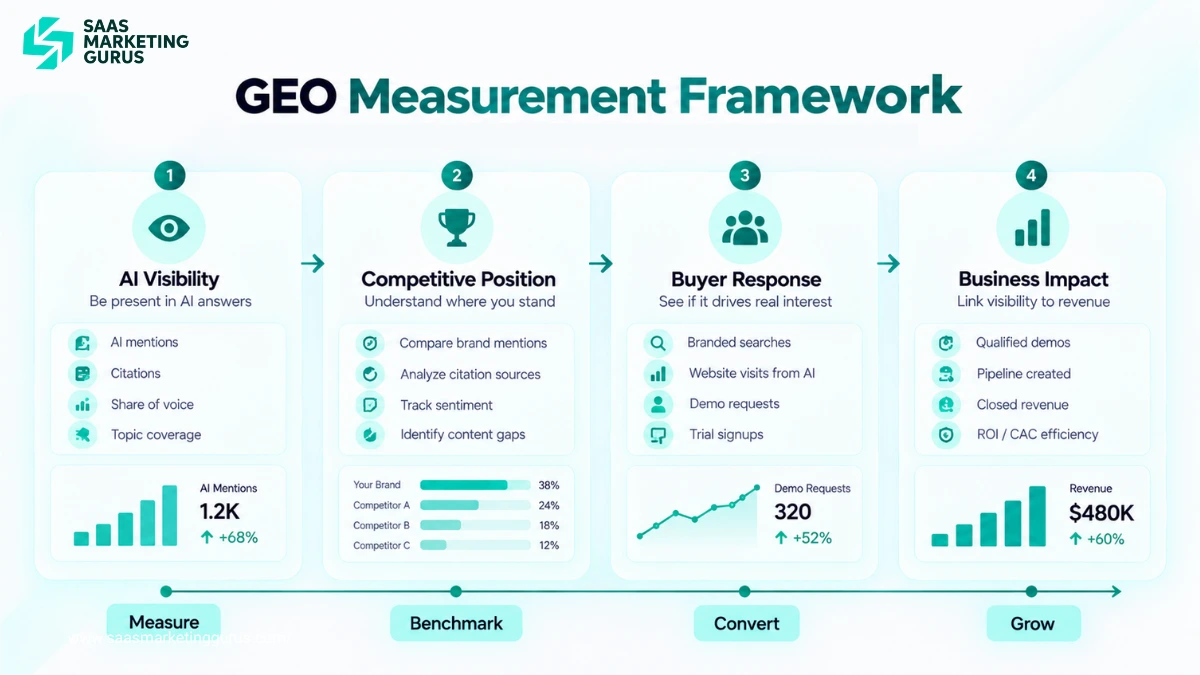
To measure GEO, track four layers against a fixed baseline: AI visibility, competitive position, buyer response, and pipeline. Generative Engine Optimization (GEO) is the work of getting your brand mentioned, cited, and recommended in AI answers from ChatGPT, Perplexity, Gemini, and Google AI Overviews. A citation shows an AI engine found you. Only qualified demos and pipeline show the campaign worked.
This guide gives you the metrics table, the step-by-step method for tracking AI citations, and the setup that connects AI visibility to revenue. If you want SMG to run the program, see our Generative Engine Optimization services.
What Does GEO Success Mean for a SaaS Company?
GEO succeeds when AI systems describe your SaaS product accurately in answers your buyers ask, and that visibility produces qualified buyer actions. Visibility without accuracy or buyer action is an early signal, not a result.
The value of an appearance depends on intent. “How to reduce customer churn” may introduce your expertise, while “best churn prediction software for enterprise SaaS” can place your product on a shortlist. Both count, but they carry different commercial weight.
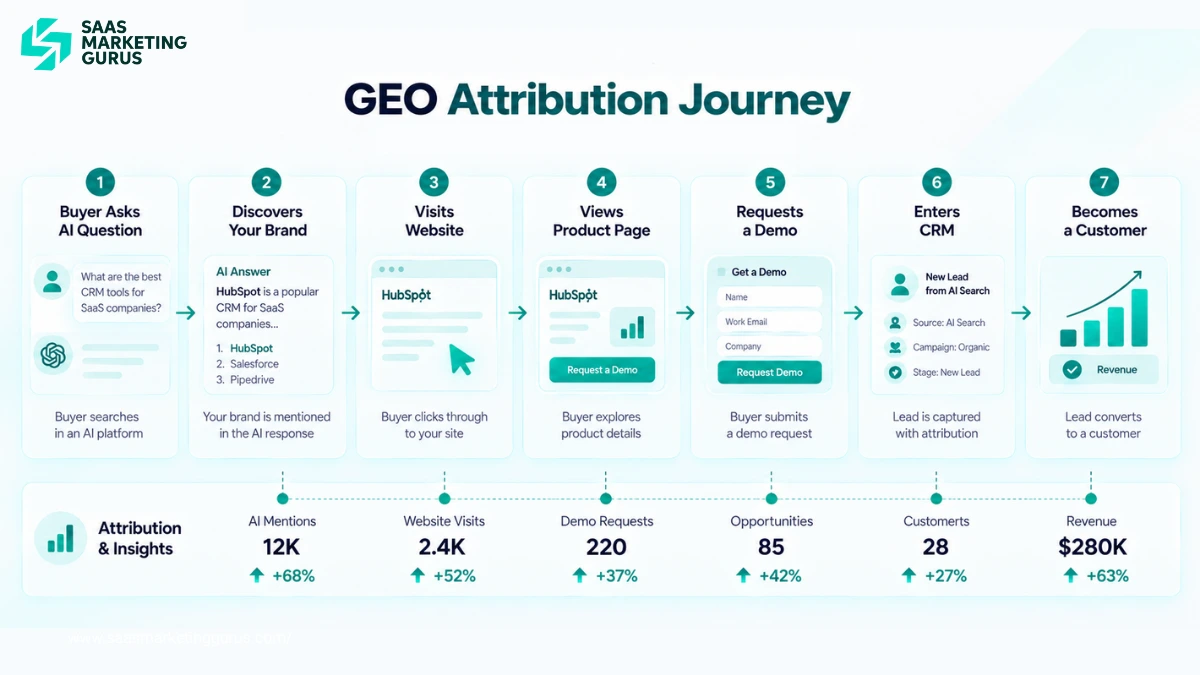
Measure success at three points in the buying journey:
- Discovery: AI systems mention or cite your brand.
- Consideration: AI systems compare or recommend your product.
- Action: Buyers visit, start a trial, book a demo, or enter the pipeline.
Accuracy sits across all three. A mention with the wrong price, audience, integration, or security detail can remove you from a shortlist. SMG’s guide to how generative search engines rank content explains the signals that drive these outcomes.
How Are AI Mentions, Citations, and Recommendations Different?
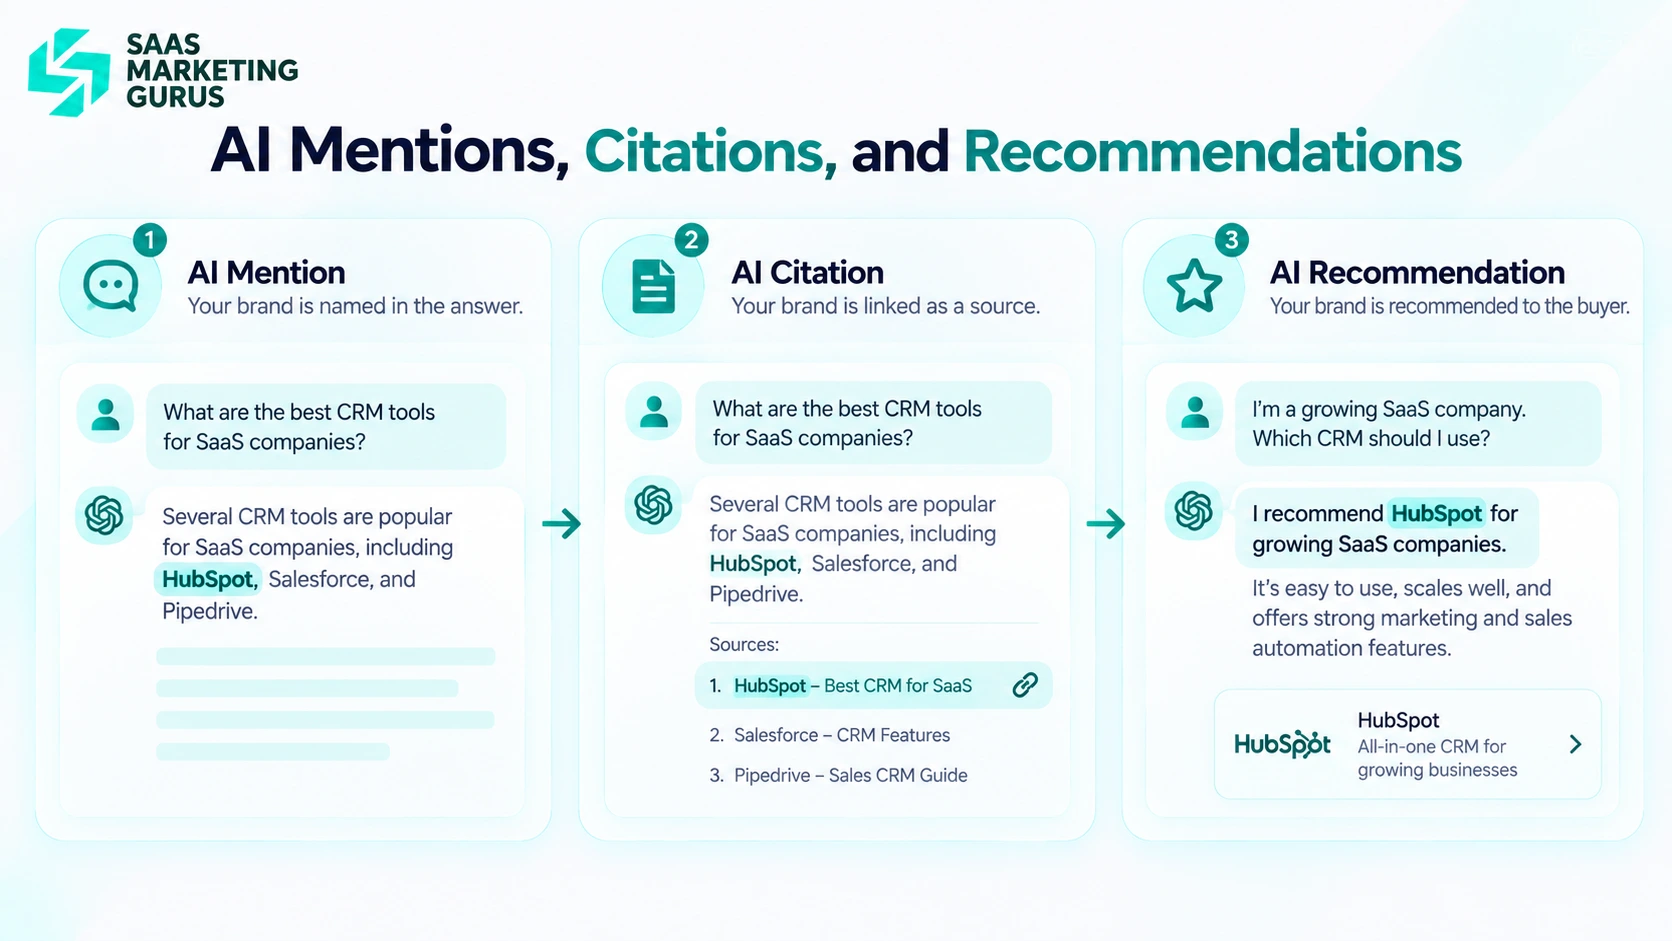
An AI mention names your company, a citation links or attributes information to your page, and a recommendation presents your product as a suitable choice. Report them separately, because each one represents a different stage of buyer influence.
| Signal | What it means | Typical SaaS value |
|---|---|---|
| Mention | The answer names your brand | Awareness |
| Citation | The answer attributes information to your page | Authority |
| Recommendation | The answer presents your product as a fit | Consideration |
| Qualified conversion | The buyer acts after direct or earlier AI exposure | Pipeline |
The gaps between these signals tell you what to fix. If an answer cites your churn benchmark but recommends two competitors, your research earns authority while your product positioning stays weak. More proof and comparison content will usually help more than another educational article.
Which Metrics Measure the Success of GEO Campaigns?
Track 13 metrics across four layers. Report the layers separately, because visibility can rise while pipeline stays flat, and you need to see which layer is failing.
| Layer | Metric | How to calculate it | Where the data comes from |
|---|---|---|---|
| AI visibility | Mention rate | Runs where your brand is named ÷ total runs | Manual prompt tests |
| AI visibility | Citation rate | Runs where your domain appears as a linked source ÷ total runs | Manual prompt tests |
| AI visibility | Prompt coverage | Prompts with at least one mention or citation ÷ total prompts | Manual prompt tests |
| AI visibility | Accuracy rate | Mentions with correct pricing, features, and category ÷ total mentions | Manual review of each answer |
| Competitive position | AI share of voice | Your mentions ÷ mentions of you plus tracked competitors | Manual prompt tests |
| Competitive position | Citation share | Your cited URLs ÷ all cited URLs across the prompt set | Manual prompt tests |
| Competitive position | Recommendation rate | Runs where you are named as a recommended option ÷ total runs | Manual prompt tests |
| Competitive position | Positive sentiment rate | Mentions framed positively ÷ total mentions | Manual review of each answer |
| Buyer response | AI referral sessions | Sessions from AI platforms | GA4 (AI Assistant channel group) |
| Buyer response | Engaged AI sessions | Engaged sessions from AI platforms ÷ AI referral sessions | GA4 |
| Buyer response | Branded search clicks | Clicks on queries containing your brand name | Google Search Console |
| Business impact | AI-sourced demos | Demos where the source field or self-reported answer names an AI tool | CRM, booking form |
| Business impact | Influenced pipeline | Open and closed opportunities with an AI touch | CRM |
Three rules keep the numbers honest:
- Count mentions and citations separately. A mention names your brand. A citation links to your page. They move for different reasons.
- Use the same prompts every cycle. Changing prompts mid-campaign breaks the trend line.
- Report sample size. “Citation rate 20%” means little without “across 30 prompts, 3 runs each.”
Start with citation rate, recommendation rate, and AI-sourced demos. Add the rest once the baseline is stable.
Which AI visibility metrics show discoverability?
AI visibility metrics show whether AI systems find and represent your brand across a fixed prompt set. Calculate each one per platform and per funnel stage, not as one blended number.
- Mention rate: answers naming your brand divided by total answers tested.
- Citation rate: answers citing your domain divided by total answers tested.
- Prompt coverage: prompts where you appear at least once divided by total prompts.
- Accuracy rate: appearances with correct product facts divided by total appearances.
For example, if your brand appears in 54 of 360 tested answers, your mention rate is 15%. Track that figure against the same prompts, platforms, and run count every cycle.
Which competitive metrics show market position?
Competitive metrics show how prominently your SaaS appears beside the alternatives buyers compare. Keep mention share and citation share separate, because a brand can be named often while a competitor owns the sources.
| Metric | Calculation | What it reveals |
|---|---|---|
| AI share of voice | Your mentions divided by all tracked brand mentions | Category awareness |
| Citation share | Your citations divided by all tracked citations | Source authority |
| Recommendation rate | Recommendations divided by commercial prompt runs | Buyer consideration |
| Positive sentiment rate | Positive descriptions divided by brand appearances | Brand framing |
Which buyer response and business metrics connect GEO with growth?
Buyer response metrics show whether AI visibility changes behavior, and business metrics show whether that behavior becomes revenue. Track AI referral sessions, engaged sessions, high-intent page visits, and branded search, then connect them to trials, demos, qualified opportunities, and pipeline.
For B2B SaaS, lead quality matters more than session volume. Ten AI-referred demo requests from your ICP beat a thousand visits to a glossary page. Branded search growth supports the case for GEO, but it does not prove it on its own.
How Do You Track AI Citations Step by Step?
Track AI citations with a fixed prompt set, repeated runs, and one log. This takes 20 to 30 prompts and about two hours per cycle by hand.
Step 1: Write 20 to 30 buyer prompts. Use the language your buyers use, not your keywords. Split them across the funnel:
| Prompt type | Share of set | Example |
|---|---|---|
| Category | 25% | “What are the best tools for [category]?” |
| Comparison | 25% | “[Your brand] vs [competitor] for [use case]” |
| Problem | 25% | “How do I fix [problem your product solves]?” |
| Alternatives | 15% | “Alternatives to [competitor]” |
| Brand | 10% | “Is [your brand] good for [use case]?” |
Keep branded prompts to 10% so the result is not inflated by prompts that already name you.
Step 2: Pick the platforms. Test ChatGPT, Perplexity, Gemini, Google AI Overviews, and Microsoft Copilot. Drop a platform only if your buyers do not use it.
Step 3: Run every prompt three times per platform. AI answers vary between runs. Use a new chat each time and the same account settings, and run the full set within one day.
Step 4: Log every run. Use one row per run with these fields:
| Field | What to record |
|---|---|
| Date | Run date |
| Platform | ChatGPT, Perplexity, Gemini, AI Overviews, Copilot |
| Prompt | The exact text |
| Prompt type | Category, comparison, problem, alternatives, brand |
| Mentioned | Yes or No |
| Cited | Yes or No, and the URL |
| Recommended | Yes or No |
| Position | Order in which your brand appears in the answer |
| Accurate | Yes or No, with the error noted |
| Competitors named | List |
| Cited domains | List every source domain shown |
Step 5: Classify each answer. Mark it as a mention, a citation, a recommendation, or none. An answer can be more than one.
Step 6: Map the cited domains. List the domains AI answers cite for your prompts. If review sites or community threads dominate, those are where to act, not only your own site. See Reddit marketing for SaaS for how community citations are built.
Step 7: Calculate the baseline and repeat. Compute the metrics from the table above. Re-run the same set weekly, review monthly, and keep a change log of every page you publish or update. Without the log, you cannot tie a citation gain to an action.
Where Does GEO Measurement Data Come From?
GEO measurement data comes from four places: your own prompt tests, Google Analytics 4, Bing Webmaster Tools, and Google Search Console. No single source covers the full path from an AI answer to a closed deal, so combine them.
How does GA4 track AI referral traffic now?
GA4 now separates chatbot traffic automatically. According to Search Engine Journal (May 2026), Google Analytics added an “AI Assistant” default channel group that assigns the medium “ai-assistant” to sessions from recognized AI referrers, with ChatGPT, Gemini, and Claude named as examples.
Google has not published the full list of recognized assistants. Keep a custom channel group with a regex for Perplexity, Copilot, and any platform you see in referral reports, and check that the two definitions agree. Visits that arrive without referrer data still land outside the channel.
What does Bing Webmaster Tools show about AI citations?
Bing Webmaster Tools reports first-party AI citation data. Microsoft’s Bing Webmaster Blog (February 2026) introduced AI Performance, a public preview that shows when your site is cited in Microsoft Copilot, AI-generated summaries in Bing, and select partner integrations, including which URLs are referenced.
This is the closest thing to a native citation report any major platform offers. Use it to validate your manual citation rate for Microsoft surfaces and to find the grounding queries you did not think to test.
What can Google Search Console tell you?
Google Search Console counts AI Overviews and AI Mode traffic, but it blends that data into overall search totals. Search Engine Journal (May 2026) notes that AI Mode data appears in Search Console performance reports without a separate category.
Use Search Console for branded query trends and for queries where your pages show impressions but clicks fall. Do not use it as a stand-alone AI visibility report.
When should you move from manual tests to monitoring software?
Manual testing works for a small prompt set and catches accuracy errors a tool may miss. Monitoring software earns its cost when you need frequent runs, several markets, historical trends, or competitor reports at scale.
Before you buy, check which models the tool covers, how it samples answers, whether it exports raw responses, and whether it tracks cited domains. SMG’s guide to AI search optimization shows how measurement fits into the wider work of earning visibility.
Which Sources Do AI Answers Cite Instead of You?
The cited-source map lists every domain AI answers cite for your priority prompts, and it tells you where to act next. Most GEO reports stop at “were we mentioned.” The map shows why you were or were not.
Build it from the cited URLs you already record. Group each domain into your own site, review platforms such as G2 and Capterra, community threads on Reddit or Quora, competitor pages, and publishers. Then count how often each group appears on commercial prompts.
The pattern points to the fix. If Reddit threads dominate comparison answers, community presence is the gap, and Reddit marketing for SaaS becomes a measurable GEO lever. If review platforms dominate, listing quality and review volume matter more than another blog post.
How Do You Connect GEO With Pipeline and Revenue?
Connect GEO with revenue through analytics, CRM source fields, self-reported attribution, and branded demand, and report directly attributed revenue separately from influenced pipeline. Mixing the two overstates GEO and damages trust in the report.
Buyers use AI tools during research without handing them the decision. According to 6sense (November 2025), 94% of buyers used large language models to summarize reviews or analyze data, yet still averaged 16 interactions per person with the winning vendor. AI shapes the shortlist, and your site and sales team still close the deal.
Set up the chain in this order:
- Keep the first landing page, source, and key page path for every AI Assistant session.
- Pass source and first-touch data into the CRM on every form fill.
- Ask “How did you first hear about us?” on demo and signup forms, with an AI assistant option.
- Tag opportunities where GEO was the first touch, an assist, or self-reported.
For directly attributable return, use: GEO ROI = (profit attributed to GEO minus campaign cost) divided by campaign cost, multiplied by 100. Influenced pipeline covers opportunities where GEO helped without being the first or last recorded touch.
SMG reports its own work the same way. The BRAVO SEO case study leads with 20+ demos per week, with organic traffic as supporting context. SMG’s guide to the SEO conversion funnel covers the page-level journey from visit to demo.
What Does GEO Measurement Look Like for a B2B SaaS Company?
A B2B SaaS team measures GEO by comparing weighted visibility, recommendations, accuracy, and qualified demos against its baseline after each content change. The following scenario is illustrative, not a client result.
A subscription billing platform targets questions about failed payments and revenue recovery. It tests 30 prompts across five funnel stages on four platforms, three runs each. It weights results by intent: 1 for problem awareness, 2 for solution research, 3 for comparison and validation, and 4 for purchase intent.
| Metric | What to evaluate | Next decision |
|---|---|---|
| Weighted citation rate | Change across the fixed prompt set | Expand pages earning relevant citations |
| Recommendation rate | Change on commercial prompts only | Add proof where mentions lack endorsement |
| Accuracy rate | Errors in pricing, integrations, security | Fix the source content and third-party listings |
| Cited-source mix | Share of review sites and communities | Invest where competitors own citations |
| Qualified demos | ICP fit of AI Assistant and self-reported leads | Improve landing paths from cited pages |
The result must lead to an action. Rising citations with flat recommendations point to weak product proof. Better recommendations without more demos point to the landing page or conversion path, not to GEO.
Which GEO Measurement Mistakes Distort Results?
GEO reports become unreliable when teams test only favorable prompts, ignore answer variation, or claim revenue without an attribution method. Each mistake has a simple correction.
| Mistake | Why it causes problems | Better approach |
|---|---|---|
| Tracking only branded prompts | Tests recognition, not discovery | Add problem, solution, comparison, and purchase prompts |
| Combining mentions and citations | Hides awareness vs authority | Report each signal separately |
| Testing a prompt once | Treats variation as a trend | Repeat priority prompts under the same conditions |
| Ignoring accuracy | Counts wrong answers as wins | Check price, audience, features, integrations, and security |
| Claiming revenue from correlation | Credits GEO without evidence | Use CRM data, self-reported attribution, and assisted journeys |
| Judging GEO by clicks alone | Misses zero-click influence | Read traffic beside visibility and branded demand |
The last row matters more each quarter. Ahrefs analyzed 300,000 keywords and found that in December 2025, an AI Overview correlated with a 58% lower average clickthrough rate for the top-ranking page. Falling clicks can coexist with rising influence, so never judge GEO on referral sessions alone.
How Often Should You Measure and Report GEO Performance?
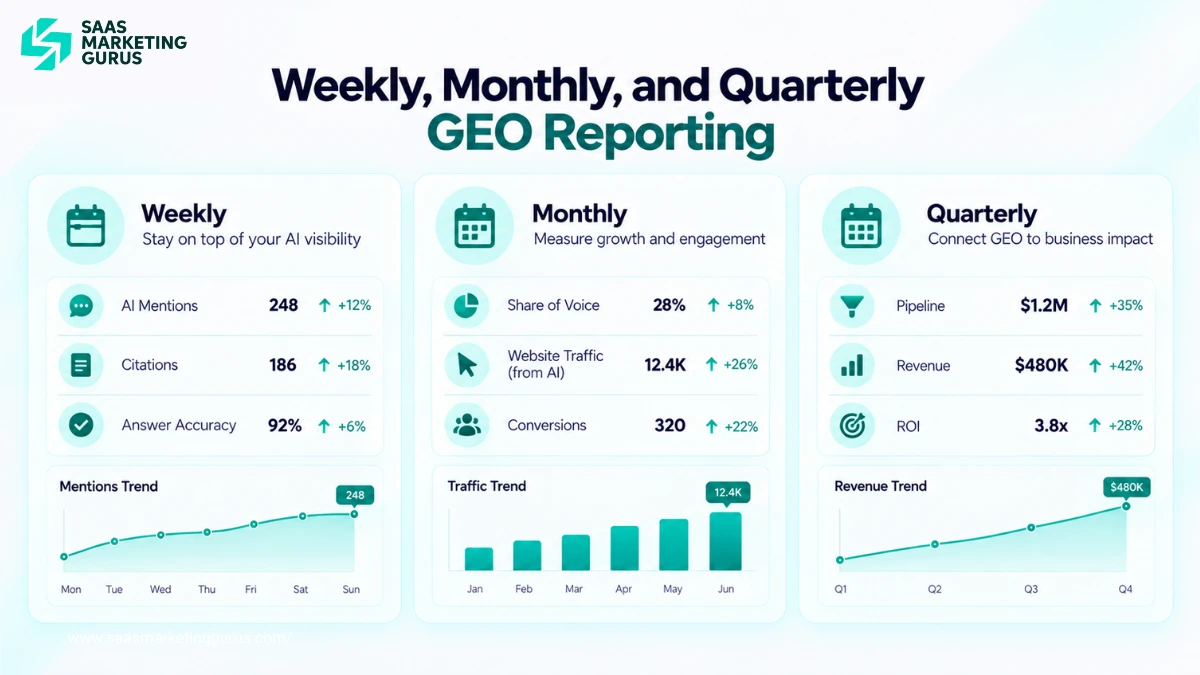
Collect visibility data weekly, review performance monthly, and evaluate pipeline quarterly. This rhythm catches real changes without overreacting to answer variation.
| Frequency | Review | Decision |
|---|---|---|
| Weekly | Mentions, citations, accuracy errors, competitor changes | Investigate sharp movement |
| Monthly | Share of voice, prompt coverage, AI Assistant sessions, conversions | Adjust content priorities |
| Quarterly | Qualified pipeline, influenced revenue, cost, prompt relevance | Continue, expand, or reduce investment |
Keep a change log for content updates, technical fixes, new listings, press coverage, and model releases. It gives every metric movement a likely cause.
How Do You Decide If a GEO Campaign Is Working?
A GEO campaign is working when repeated tests show stronger weighted visibility and recommendations, accuracy holds, and qualified actions rise against the baseline. Write these rules down before you review the numbers.
- Continue when citation coverage, recommendations, accuracy, and qualified actions improve together.
- Adjust when mentions rise without recommendations, or AI visitors reach weak conversion paths.
- Expand when gains hold across platforms for two cycles and pipeline supports more investment.
- Treat as inconclusive when the prompt set is too small, the baseline is missing, or test conditions changed.
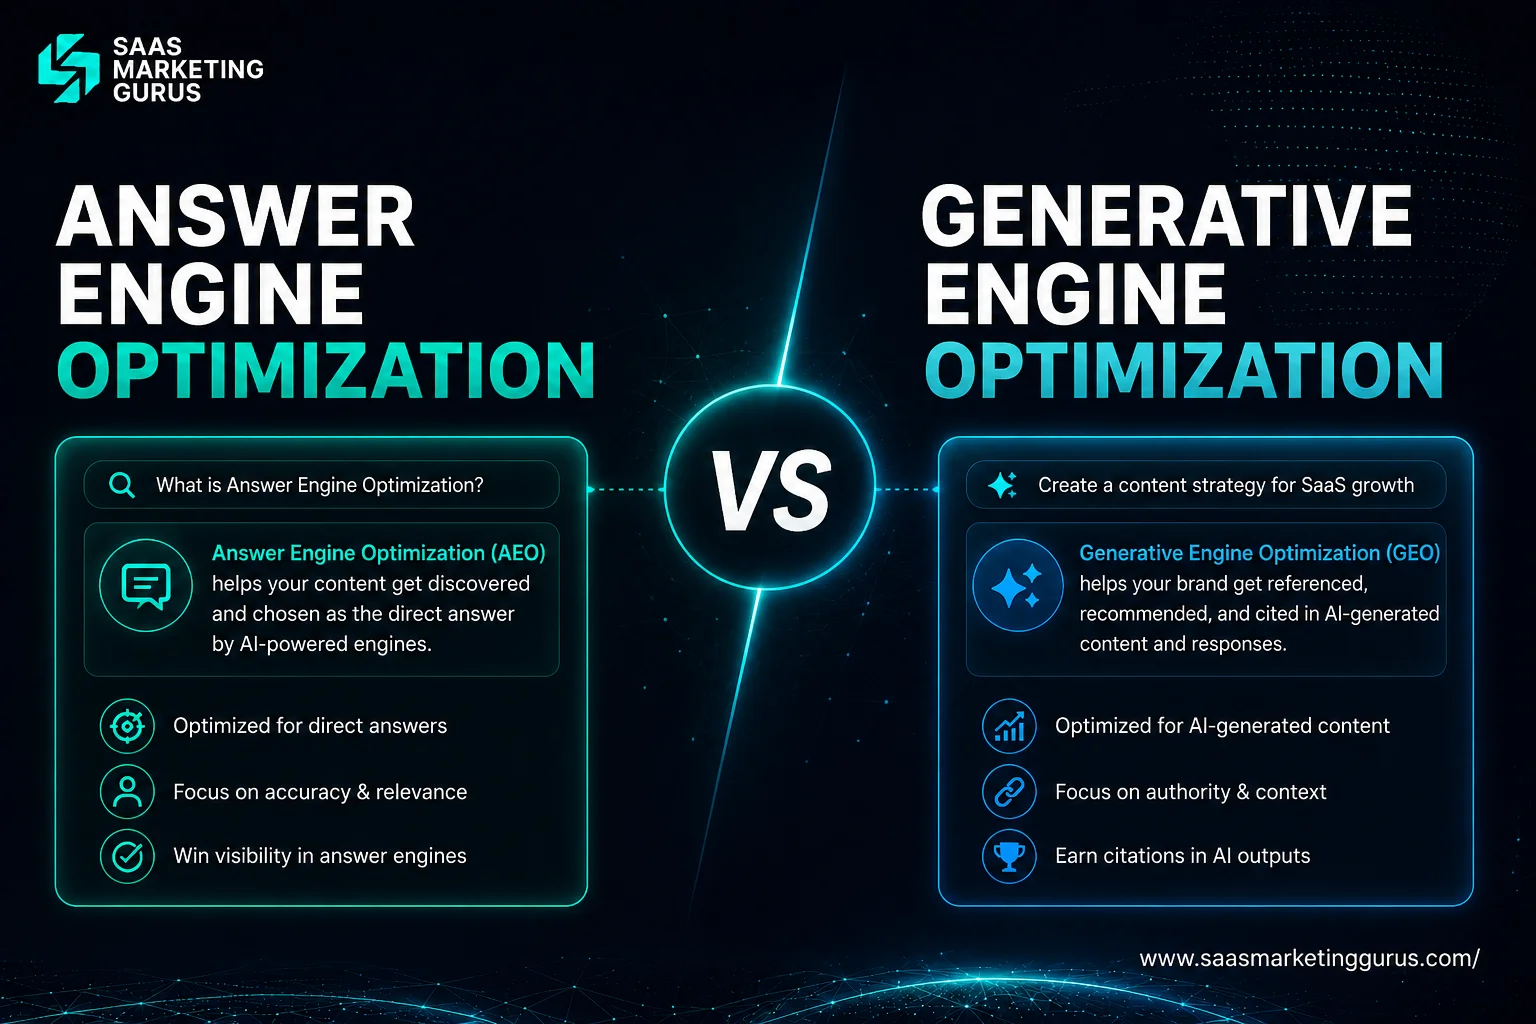
GEO and AEO share most of these metrics, so if your team runs both programs, use one scorecard. SMG’s comparison of AEO vs GEO explains where the two disciplines differ.
Measure GEO Campaign Success as a Pipeline Channel
The way to measure the success of generative engine optimization campaigns is to hold the prompt set steady, keep visibility and pipeline in separate layers, and judge the campaign on qualified buyer actions. Citations are the leading indicator. Demos and pipeline are the verdict.
Start this month with 20 to 30 buyer prompts, three runs per platform, and the GA4 AI Assistant channel plus a CRM source field. After one quarter, success looks like a higher weighted recommendation rate, zero critical accuracy errors, and more ICP-fit demos with AI influence recorded. Review the rules at the quarter mark and decide to continue, adjust, or expand.
If you want this scorecard built around your category and connected to your CRM, book a free strategy call with SMG. We will map the prompts your buyers ask, the sources AI cites instead of you, and the reporting that ties GEO services to pipeline.
Frequently Asked Questions
What is the most important GEO metric for a SaaS company?
The most important GEO metric for a SaaS company is recommendation rate on commercial prompts, because it shows whether AI answers put your product on buyer shortlists. Citation rate measures authority and qualified pipeline measures revenue impact. Track all three, then prioritize the one closest to your campaign goal.
How many prompts should a SaaS company track for GEO?
A focused SaaS company can start with 20 to 30 prompts covering problem, solution, comparison, purchase, and validation questions. Run each prompt several times per platform. Larger platforms should split prompts by product, audience, or market so strong results in one segment do not hide gaps in another.
How long does it take to see GEO results?
GEO visibility changes can appear within a few monthly cycles, while pipeline impact usually shows over one or more quarters because B2B SaaS sales cycles take time. Crawl timing, competition, brand authority, content quality, and model updates all affect pace. Judge business impact quarterly, not weekly.
Can GA4 track traffic from ChatGPT and other AI platforms?
Yes. Since May 2026, GA4 groups sessions from recognized AI assistants such as ChatGPT, Gemini, and Claude into an “AI Assistant” default channel. It cannot show the original prompt or answers that produced no click, so pair it with prompt testing, CRM source fields, and self-reported attribution.
What is a good AI share of voice for a SaaS brand?
A good AI share of voice is one that rises against your own baseline on comparison and purchase prompts in your target market. No universal SaaS benchmark exists, because results change by platform, competitor set, location, intent, and sampling method. Compare like with like over time.
Can you measure GEO without paid software?
Yes. Test a fixed prompt set manually, record mentions, citations, recommendations, accuracy, and cited domains in a spreadsheet, and add free first-party data from GA4 and Bing Webmaster Tools. Paid monitoring software becomes worth it when you need frequent runs, several markets, or competitor reporting at scale.
How do you prove GEO influenced revenue?
Prove GEO influence by combining AI Assistant sessions, CRM source fields, assisted conversions, self-reported attribution, and qualified opportunities at the account level. No single signal proves causation. Report directly attributed revenue separately from influenced pipeline, and state the rule used for each category in every report.